What is Analytics? How to use Google Analytics to analyze data
We are living in an era where data has become an incredibly valuable resource, useful across various industries and fields. As a result, data analytics has gained more attention and popularity. So, to understand what Analytics is and how to use Google Analytics tools, continue reading this article!
I. What is Analytics?
1. Definition of Analytics
Analytics refers to the process of discovering, interpreting, and communicating important information from data. This analysis helps us uncover insights and meaningful data that we might not be able to detect on our own.

See more products: Buy advertising accounts
2. The History of Analytics
In 1785, William Playfair introduced the concept of the bar chart, one of the most basic and widely used data visualization features. In 1890, Herman Hollerith invented the “tabulating machine,” which recorded data on punched cards. This allowed for faster data analysis, accelerating the US Census counting process from seven years to just 18 months. In the 1970s-1980s, the development of relational databases (RDB) and Structured Query Language (SQL) software allowed for the extrapolation of data for customized analysis. By the late 1980s, William H. Inmon proposed the concept of a “data warehouse,” where information could be quickly accessed and repeatedly used. In the 1990s, the concept of data mining allowed businesses to analyze and explore patterns in large datasets.
Data analysts and data scientists flocked to programming languages like R and Python to develop machine learning algorithms, work with large datasets, and create complex data visualizations. By the 2000s, innovations in web search led to the development of MapReduce, Apache Hadoop, and Apache Cassandra to help explore, prepare, and present information.
II. What is Data Analytics?
1. Definition of Data Analytics
Data Analytics refers to the process of examining, cleaning, transforming, and modeling data. The goal of Data Analytics is to uncover useful information, inform conclusions, and support decision-making. There are various methods and techniques for data analysis, but analysts choose the most appropriate method depending on the industry and purpose.

2. Some Terms in Data Analytics
-
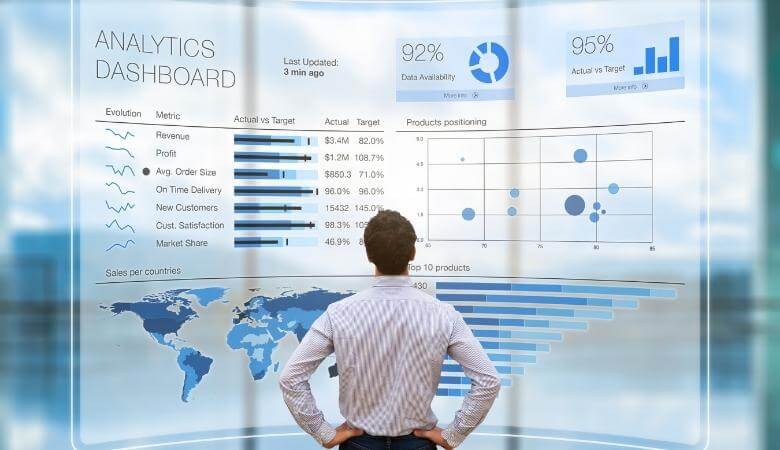
Data Visualization: Presenting information in graphs or images to clearly and attractively illustrate trends and patterns. This skill is essential when analysts need to present key conclusions to upper management.
-
Exploratory Data Analysis: A method for interpreting data using various statistical charts, encouraging testing and experimentation before making assumptions.
-
Data Model: A way of organizing and structuring data elements, establishing relationships between different types of information to create visual models.
-
Analytical Database: Software that maintains and facilitates data manipulation.
-
Data Cleaning/Data Cleansing: The activity of identifying and removing inaccurate, faulty, or irrelevant data points. Data cleaning is often the first step in the analysis process.
III. Distinguishing Data Analytics and Data Analysis
The main difference between Data Analytics and Data Analysis lies in their scope. Data Analytics is a broader term, while Data Analysis is just one component. Data Analytics is a comprehensive field or discipline that includes the management of entire datasets.
This encompasses not only analysis but also the collection, organization, storage of data, and all the tools and techniques used. Data Analysis, on the other hand, refers to the process of examining, transforming, and organizing a specific dataset in particular ways to study its individual components and extract useful information.
IV. Benefits of Data Analytics in Business
1. Improved Decision Accuracy
Thorough data analysis helps business owners make well-informed decisions based on solid foundations, eliminating subjective guesswork when proposing plans. Moreover, this process provides a detailed understanding of customer problems, enabling decisions to improve relevant programs and plans. With the advancement of modern data analytics technology, you can continuously collect and analyze new data, updating the latest information in real-time.
2. More Effective Marketing Campaigns
A successful and effective marketing campaign always starts with a deep understanding of the target customers. Data Analytics plays a critical role in helping marketers collect and analyze customer data to uncover insights, understand needs, and consumer behavior, thus proposing marketing campaigns that resonate with the target audience. Nowadays, there are many Data Analytics tools that help gather insights and identify which group is likely to engage with campaigns and have a higher conversion potential.
See more products: Buy advertising accounts
3. Better Customer Service
Thanks to data analysis, businesses gain a better understanding of customer needs, enabling them to provide more relevant services that improve customer relationships. Moreover, modern Data Analytics tools can also personalize information, showing customized interfaces for each customer group in the behavioral classification funnel.
4. More Efficient Operations
Data Analytics helps businesses streamline operations, save costs, and optimize business results. Once you know what customers want, you can save more time by designing advertisements that align with the needs of your target audience.
V. Types of Data Analytics
-
Descriptive Analysis: Descriptive analysis helps summarize large datasets to describe outcomes for stakeholders. By developing performance indicators (KPIs), return on investment (ROI), and other specialized metrics to monitor performance, success, or failure in specific industries. This process involves collecting relevant data, processing it, analyzing it, and visualizing it to provide insights into past performance.
-
Predictive Analysis: Predictive analysis helps answer questions about what will happen in the future. These techniques use historical data to identify trends and determine if they are likely to recur. Predictive tools provide valuable insights into potential future events, utilizing various statistical and machine learning techniques, such as neural networks, decision trees, and regression.
-
Diagnostic Analysis: Diagnostic analysis helps answer questions about why something happened. These techniques complement basic descriptive analysis. From the findings of descriptive analysis, you can dig deeper to identify the causes. Performance metrics are further examined to determine why they improved or declined. This process generally consists of three steps: Identifying anomalies in the data, collecting relevant data about these anomalies, and using statistical techniques to find relationships and trends that explain these anomalies.
-
Prescriptive Analysis: Prescriptive analysis helps answer questions about what you should do. By using insights from predictive analysis, businesses can make data-driven decisions. This enables companies to make informed decisions when facing uncertainty. Prescriptive analysis techniques rely on machine learning strategies, computer science, and mathematics. By analyzing past decisions and events, you can estimate the likelihood of various outcomes.
VI. Data Analysis Process
-
Data Requirement: The first step is to identify the type of data needed for the task or problem to be analyzed. For example, if you want to know the purchase conversion rate, you need to know the total number of users who visit the site and the total number of users who make a purchase.
-
Data Collection: After determining the necessary data, you will need to gather the data using various methods. The collected data must be highly accurate and error-free. If the collected data is inaccurate, the conclusions drawn will be incorrect.

-
Data Processing: The raw data collected must be organized and distributed in a scientific manner. You can organize the data in Excel using rows and columns.
-
Data Cleaning: Not all data is useful; some data may contain errors. Therefore, at this stage, data is cleaned, corrected, or errors are removed. To ensure accuracy, this step must be handled carefully.
-
Data Analysis: This is arguably the most mentally demanding step because you need to use the analyzed data to draw conclusions. You can use data analysis tools and techniques to visualize data, analyze correlations, and perform regressions.
-
Communication: After completing the data analysis, you need to transform it into useful information, simplifying it in the form of charts, tables, or graphs to interpret, present, discuss, and communicate with the stakeholders who need to use the analysis results, such as leaders, directors, and project managers.
VII. Introduction to Google Analytics Tools
1. What is Google Analytics?
Google Analytics is a tool developed by Google to help website administrators easily manage their website’s performance and suggest improvements for effective development. Google Analytics works by automatically tracking, measuring, analyzing, and reporting website traffic data. The data provided by this tool is guaranteed by Google to be completely accurate.
2. Benefits of Using Google Analytics
Google Analytics helps users view an overall picture of the data, understand how the data works, and discover unique insights that only Google can provide. This tool also helps increase conversion rates by synchronizing Insight data with advertising tools, making customer targeting more accurate and effective. In general, Google Analytics helps users maximize their data, bringing significant benefits to businesses and stores that use websites for sales purposes.
See more products: Buy advertising accounts
3. Useful Features from Google Analytics
-
Smart Data Analysis: Allows multiple people to collaborate and access shared data for analysis. Analytics automatically analyzes and provides insights on keywords, emerging trends from your data. It can also connect and integrate with other Google tools like Smart Goals, Smart Lists, and Session Quality.
-
Variety of Reports: Analytics provides multiple types of reports to make analysis more comprehensive. User reports provide an overview of website visitors, including user activities, frequency, and lifetime value. Behavioral reports analyze user actions on the website and the reasons behind those actions. Conversion reports show the effectiveness of marketing channels and detailed actions within each channel. Real-time reports display activities and behavior at the current moment.
-
Data and Interface Personalization: Google Analytics can access users’ historical data and personalize it, categorizing users into multi-channel funnels and shopping funnels accordingly. It also displays customized interfaces with different components for each target audience.
-
Data Collection and Management: Google Analytics helps systematically organize data using integrated features such as API, tag management, and custom variables. Additionally, you can import external data to combine with existing datasets.
-
Data Processing: Analytics analyzes and provides basic demographic data about users, such as age, gender, and location. It continuously analyzes user insights, alerts you to data errors, and helps detect potential growth opportunities and risks as early as possible.
-
Tool Integration: Google Analytics integrates well with many other tools, making the analysis process both effective and time-efficient. Some popular tools include Google Ads, Google Adsense, Salesforce, and Google Search Console.
4. Key Metrics Tracked with Google Analytics
-
Users: A user is someone who accesses the website, each with a unique ID address. The total number of users who visit the website within a specified time frame is referred to as traffic.
-
Session: A session is a series of actions or interactions performed by a user on the website during a single visit. A session starts when a user accesses the website and ends after 30 minutes of inactivity, or when the user closes the browser or accesses another site and does not return within 30 minutes.
-
Average Session Duration: This metric shows the average length of time users spend on the website during a session, calculated by dividing the total session duration by the total number of sessions.
-
Pages per Session: This metric shows the average number of pages a user views during a session.
-
Pageviews: This metric counts the total number of times a page is viewed by all users. Even if a user accesses the page without interacting with it or exits immediately, it is still counted as one pageview.
-
Bounce Rate: The bounce rate is the percentage of users who visit the website and leave without interacting with it (single-page sessions). A high bounce rate indicates that the website does not provide useful or engaging content, which may result in poor Google ratings.
-
Conversion Rate: The conversion rate refers to the percentage of visitors who perform specific actions on the website, such as becoming customers or completing other targeted actions.
If you need the most reputable payment method and advertising account provider, you can message the fanpage buybm365.com-Ads to receive advice from HT Media. In addition, you can follow the articles. Latest articles related to our Digital Marketing.


